Used more often in commercial settings, home users are often unaware that you can group and collapse both rows and columns in an Excel worksheet to hide information until it is needed. This is especially useful when you use formulas in a spreadsheet to summarize information and you are only interested in those summaries most of the time.
Grouping Rows and Columns in an Excel Worksheet
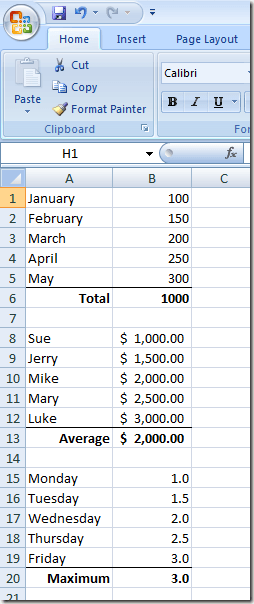
Suppose you have an Excel worksheet that looks like the one pictured below. Notice that there are a number of cells that contain data and that each set of data is summarized in a separate cell (B6, B13, and B20).
The trouble you are having is that the data in the cells (B1 to B5, B8 to B12, and B15 to B19) are not useful to you on a regular basis; you only care about the total, average, and maximum values for each set of data respectively. Using Excel’s Group function, you can group these data together separately and collapse them out of view. When you need to view or edit the data, you can expand the groups and work with them again. As an example, let’s group rows 8 through 12 together, collapse them, and leave only the Average in row 13 visible. Begin by selecting rows 8 through 12 with your mouse. Click on the Data tab on the Ribbon and locate a section of the Ribbon labeled Outline. Click on the button labeled Group and select Group from the menu.
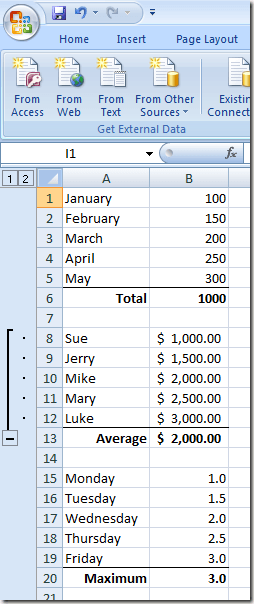
You’ll immediately notice a change to the Excel worksheet that you may never have seen before. Next to rows 8 through 12, there is a line connecting these rows to the left and there is a minus sign next to row 13. This signifies that cells 8 through 12 are part of a group that is currently expanded.
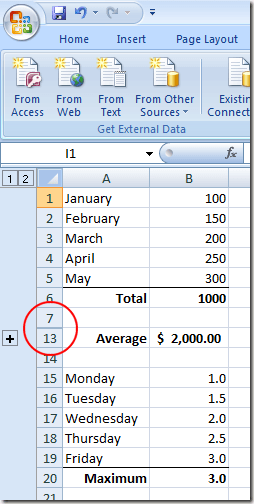
If you click the minus sign next to row 13, rows 8 through 12 will collapse and the minus sign turns into a plus sign. This also signifies that rows 8 through 12 are part of a group and that the group is currently collapsed. Clicking on the plus sign will expand the group again. Also, notice that when collapsed, the rows in the worksheet go right from row 7 to row 13, a sure sign that some of the rows in the worksheet have been grouped and are currently collapsed.
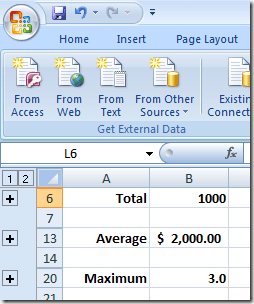
If we do the same for rows 1 through 5 and rows 15 through 19, we see that when these rows are grouped and collapsed, the original data is hidden from view making the important cells more easily found. Notice that the three plus signs in the left hand gutter of the worksheet indicate that there are currently three collapsed groups of rows.
Grouping and collapsing cells in Excel is not limited to rows; you can group and collapse columns as well. It is even possible to create groups within groups to better organize data that has become difficult with which to work in a bloated Excel worksheet.


